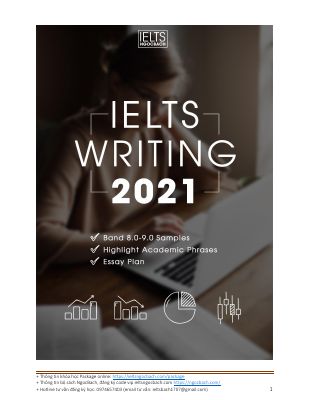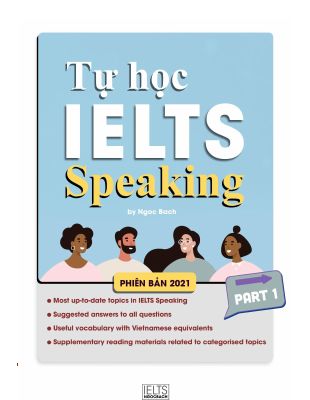

(IELTS Ngocbach) Phương pháp tự học IELTS Writing task 1 mới phiên bản 2019
Báo tài liệu không phù hợp
Xem trước nội dung
+ Để tìm hiểu thông tin về khóa học, bộ sách mới nhất của thầy Bách, các bạn truy cập: www.ngocbach.com + Liên hệ với IELTS Ngoc Bach, các bạn vào www.ngocbach.com mục “Liên hệ.” 2
Contents
I. LINE GRAPH ..................................................................................................................................... 6
Ví dụ 1: birth rates of China and the USA ................................................................................................ 7
Ví dụ 2: price changes for fresh fruits and vegetables, sugars and sweets, and carbonated drinks ........ 9
Ví dụ 3: the consumption of fish and some different kinds of meat ......................................................... 12
Ví dụ 4: tourists to England who visited four different attractions in Brighton. .................................... 15
Ví dụ 5: the amount of money spent on books in Germany, France, Italy and Austria .......................... 17
Ví dụ 6: Income differences between genders ......................................................................................... 18
Ví dụ 7: Cinama attendance by age group (03/11/2016) ........................................................................ 21
Ví dụ 8: Car production in the US (05/11/2016) .................................................................................... 22
Ví dụ 9: Oil use of major consumers (22/10/2016) ................................................................................. 24
Ví dụ 10: Changes in UK birth rate (24/12/16) ...................................................................................... 28
Ví dụ 11: Percentage of female MPs (03-06-2017) ................................................................................ 30
Ví dụ 12: Value of Australian trading with China, Japan and the United States (15/10/2017) ............. 32
Ví dụ 13: Overseas visitors to three different areas of a European country between 1987 and 2007 (16/12/2017) ............................................................................................................................................ 35
II. BAR CHART ..................................................................................................................................... 38
Ví dụ 1: the most common sports played in New Zealand ...................................................................... 39
Ví dụ 2: Oil Production Capacity ........................................................................................................... 42
Ví dụ 3: Fast food ................................................................................................................................... 45
Ví dụ 4: the scores of teams A, B and C over four different seasons ...................................................... 47
Ví dụ 5: the different modes of transport used to travel to and from work in one European city ........... 49
Ví dụ 6: the division of household tasks by gender in Great Britain. ..................................................... 52
Ví dụ 7: the amount of leisure time ......................................................................................................... 54
Ví dụ 8: sales of games ........................................................................................................................... 56
Ví dụ 9: Marriages in America ............................................................................................................... 58
Ví dụ 10: Imprisonment statistics............................................................................................................ 60
Ví dụ 11: reasons for study ..................................................................................................................... 62
Ví dụ 12: Film production in 5 countries ................................................................................................ 64
Ví dụ 13: renewable energy of the total …
Trên đây là phần đầu tài liệu — bấm Đọc sách để xem đầy đủ.