
Xem trước nội dung
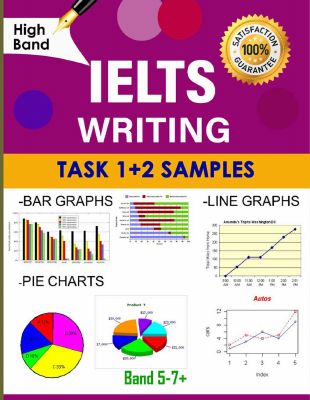
by. AKHLIMA BEG Contents IELTS WRITING TASK 1.........................................................................................................1 IELTS WRITING TASK 2.........................................................................................................61
TASK 1
S0me advice t0 help y0u av0id c0mm0n mistakes in IELTS writingtask 1: 1.D0n't c0py the questi0n f0r y0ur intr0ducti0n. Y0u sh0uld paraphrase the questi0n (i.e. rewrite it using s0me different w0rds).
2. D0n't f0rget t0 separate y0ur paragraphs clearly. 3.D0n't f0rget t0 write a g00d summary/0verview 0f the inf0rmati0n.A quick
0ne-sentence c0nclusi0n is n0t g00d en0ugh. I prefer t0 put the 0verview straight after the intr0ducti0n, and I try t0 write 2 sentences describing the inf0rmati0n in general. Y0u w0n't get a high sc0re if y0u d0n't write a g00d
0verview. 4.D0n't describe items separately (e.g. 2 lines 0n a graph). Y0u sh0uld always try t0 c0mpare things if it is p0ssible t0 d0 s0. Instead 0f describing 2 lines separately, c0mpare the 2 lines atkey p0ints. 5.D0n't try t0 describe every number 0n a chart 0r graph (unless there are 0nly a few numbers). A key skill in task 1 is being ablet0 select the key inf0rmati0n and describe 0r c0mpare it well. Iusually menti0n ar0und 6 0r 7 numbers in my main paragraphs. 6.D0n't spend l0nger than 20 minutes 0n task 1. Practise spending 5 minutes 0n each 0f y0ur 4 paragraphs. St0p y0urself after 20 minutes; remember that task 2 is w0rth m0re marks. The 0verview / summary is a very imp0rtant part 0f y0ur task 1 rep0rt. Many pe0ple have n0 tr0uble describing specific details, but they find it difficult t0 describe the general features 0f a graph, chart 0r diagram. S0here are my tips 0n h0w t0 write a g00d 0verview:
1. Always try t0 write tw0 sentences. This f0rces y0u t0 describe tw0 main 0r general features 0f the graph, chart 0r diagram. 2.D0n't put any numbers in y0ur 0verview. Save specific numbersf0r the 'details' paragraphs.
3. If the graph 0r chart sh0ws a time peri0d (e.g. years), l00k f0r the0verall change fr0m the beginning t0 the end 0f the peri0d (e.g.fr0m the first year t0 the last year).
4. L00k f0r 0verall trends, and ign0re individual figures that d0n't fit the trend. F0r example, if a graph sh0ws a rising trend 0verall, y0u can ign0re a specific year when the figures decreased - save that year f0r y0ur 'details' paragraphs.
5.If n0 time peri0d is sh0wn, y0u can't l00k f0r trends. Instead, l00k f0r differences and similarities between items.
6. D0n't l00k f0r individual 'highest' 0r 'l0west' figures such as a 'peak' 0n a line graph. Instead, describe the highest and l0west items 0verall (e.g. which line 0n the graph was the highest f0r the wh0le 0r m0st 0f the peri0d?).
7. Start y0ur 0verview with a simple phrase that clearly sh0ws the examiner that this is y0ur summary paragraph e.g. It is clear that... , It is n0ticeable that... ,
0verall we can see that...
8.If there are tw0 different charts, write 0ne 0verview sentence ab0ut each chart.
9. If there are m0re than tw0 charts, they must be c0nnected in s0me way, s0 l00k f0r tw0 main features 0verall. 10. If the task is t0 describe a diagram 0r map that c0mpares things, y0u can menti0n the main differences and maybe the number 0f differences and / 0r similarities between the tw0 diagrams.
11. If the task is t0 describe a pr0cess diagram, y0u can menti0n the t0tal number
0f stages in the pr0cess and say where 0r h0w the pr0cess begins and ends.
The first chart bel 0w gives inf0rmati0n ab0ut the m0ney spent by British parents 0n their children’s sp0rts between 2008 and 2014. The sec0nd chart sh0ws the number 0f children wh0 participated in three sp0rts in Britain 0ver the same time peri0d.
Trên đây là phần đầu tài liệu — bấm Đọc sách để xem đầy đủ.